Advanced UAV-based data collection and analysis solutions tailored to your project needs.
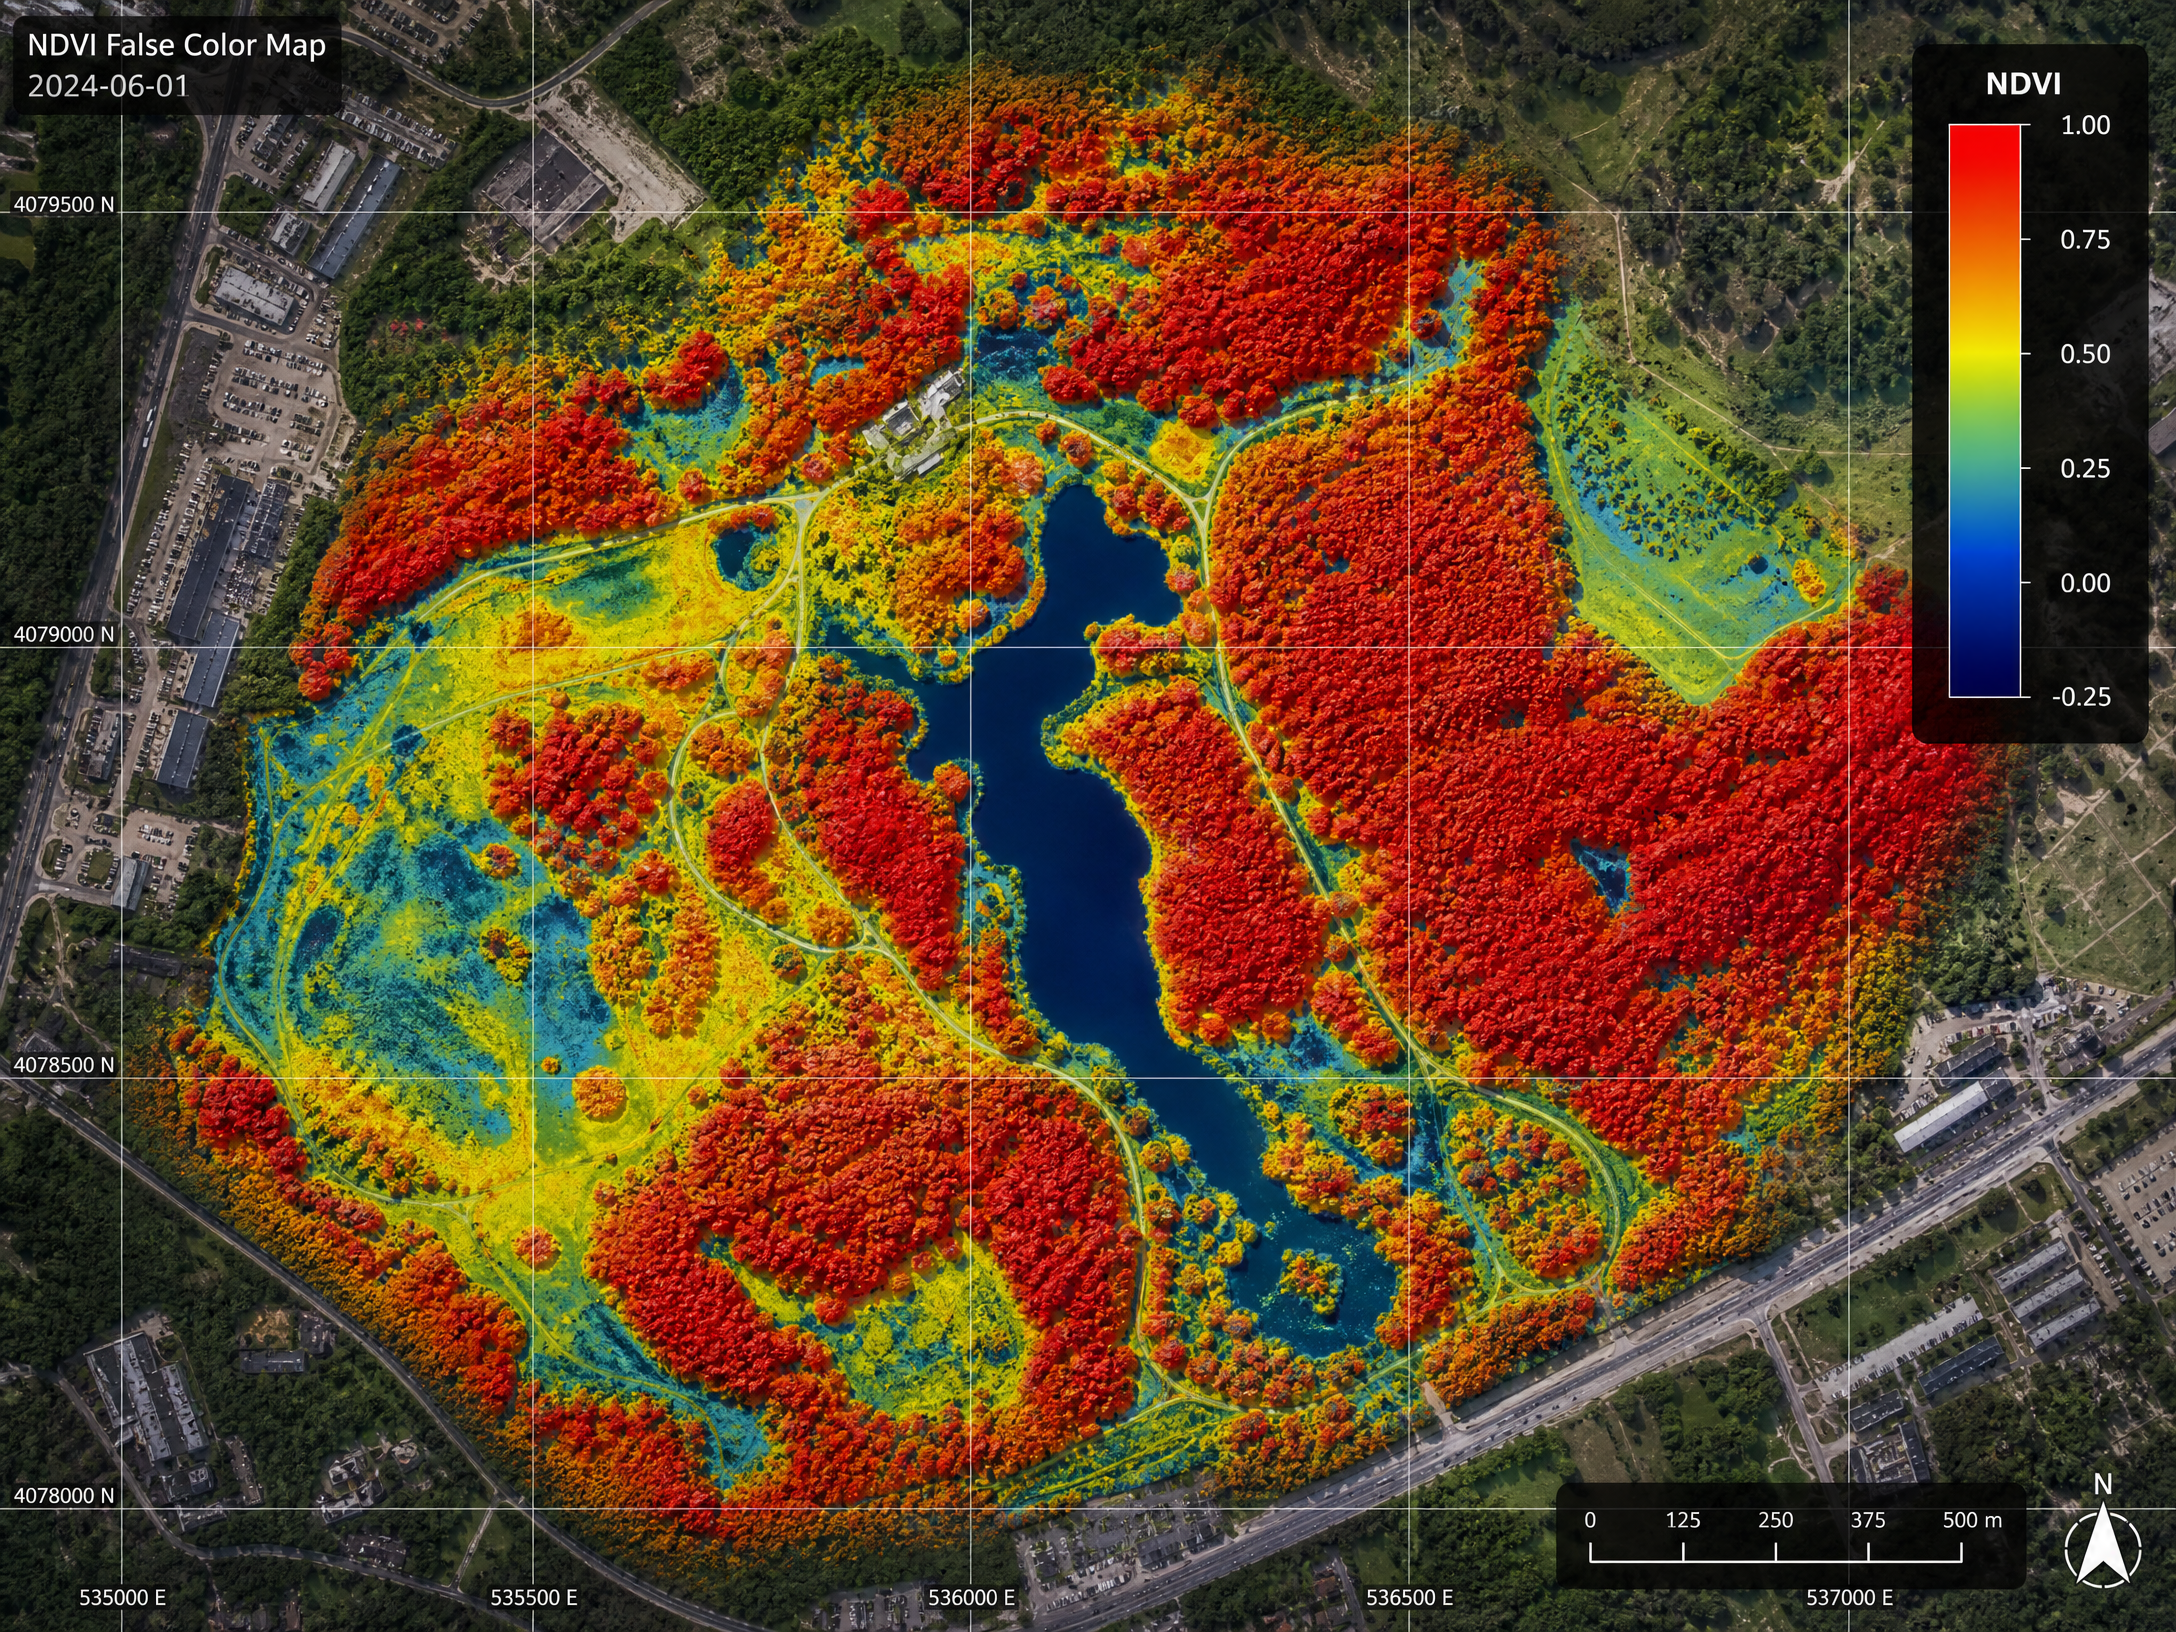
Our multispectral sensors capture data across five spectral bands β Blue, Green, Red, Red Edge, and Near-Infrared β enabling the calculation of powerful vegetation health indices that are invisible to the naked eye.
Key indices we deliver include NDVI (Normalized Difference Vegetation Index), NDRE (Normalized Difference Red Edge), CWSI (Crop Water Stress Index), and EVI (Enhanced Vegetation Index). Each provides unique insights into plant physiology and stress.
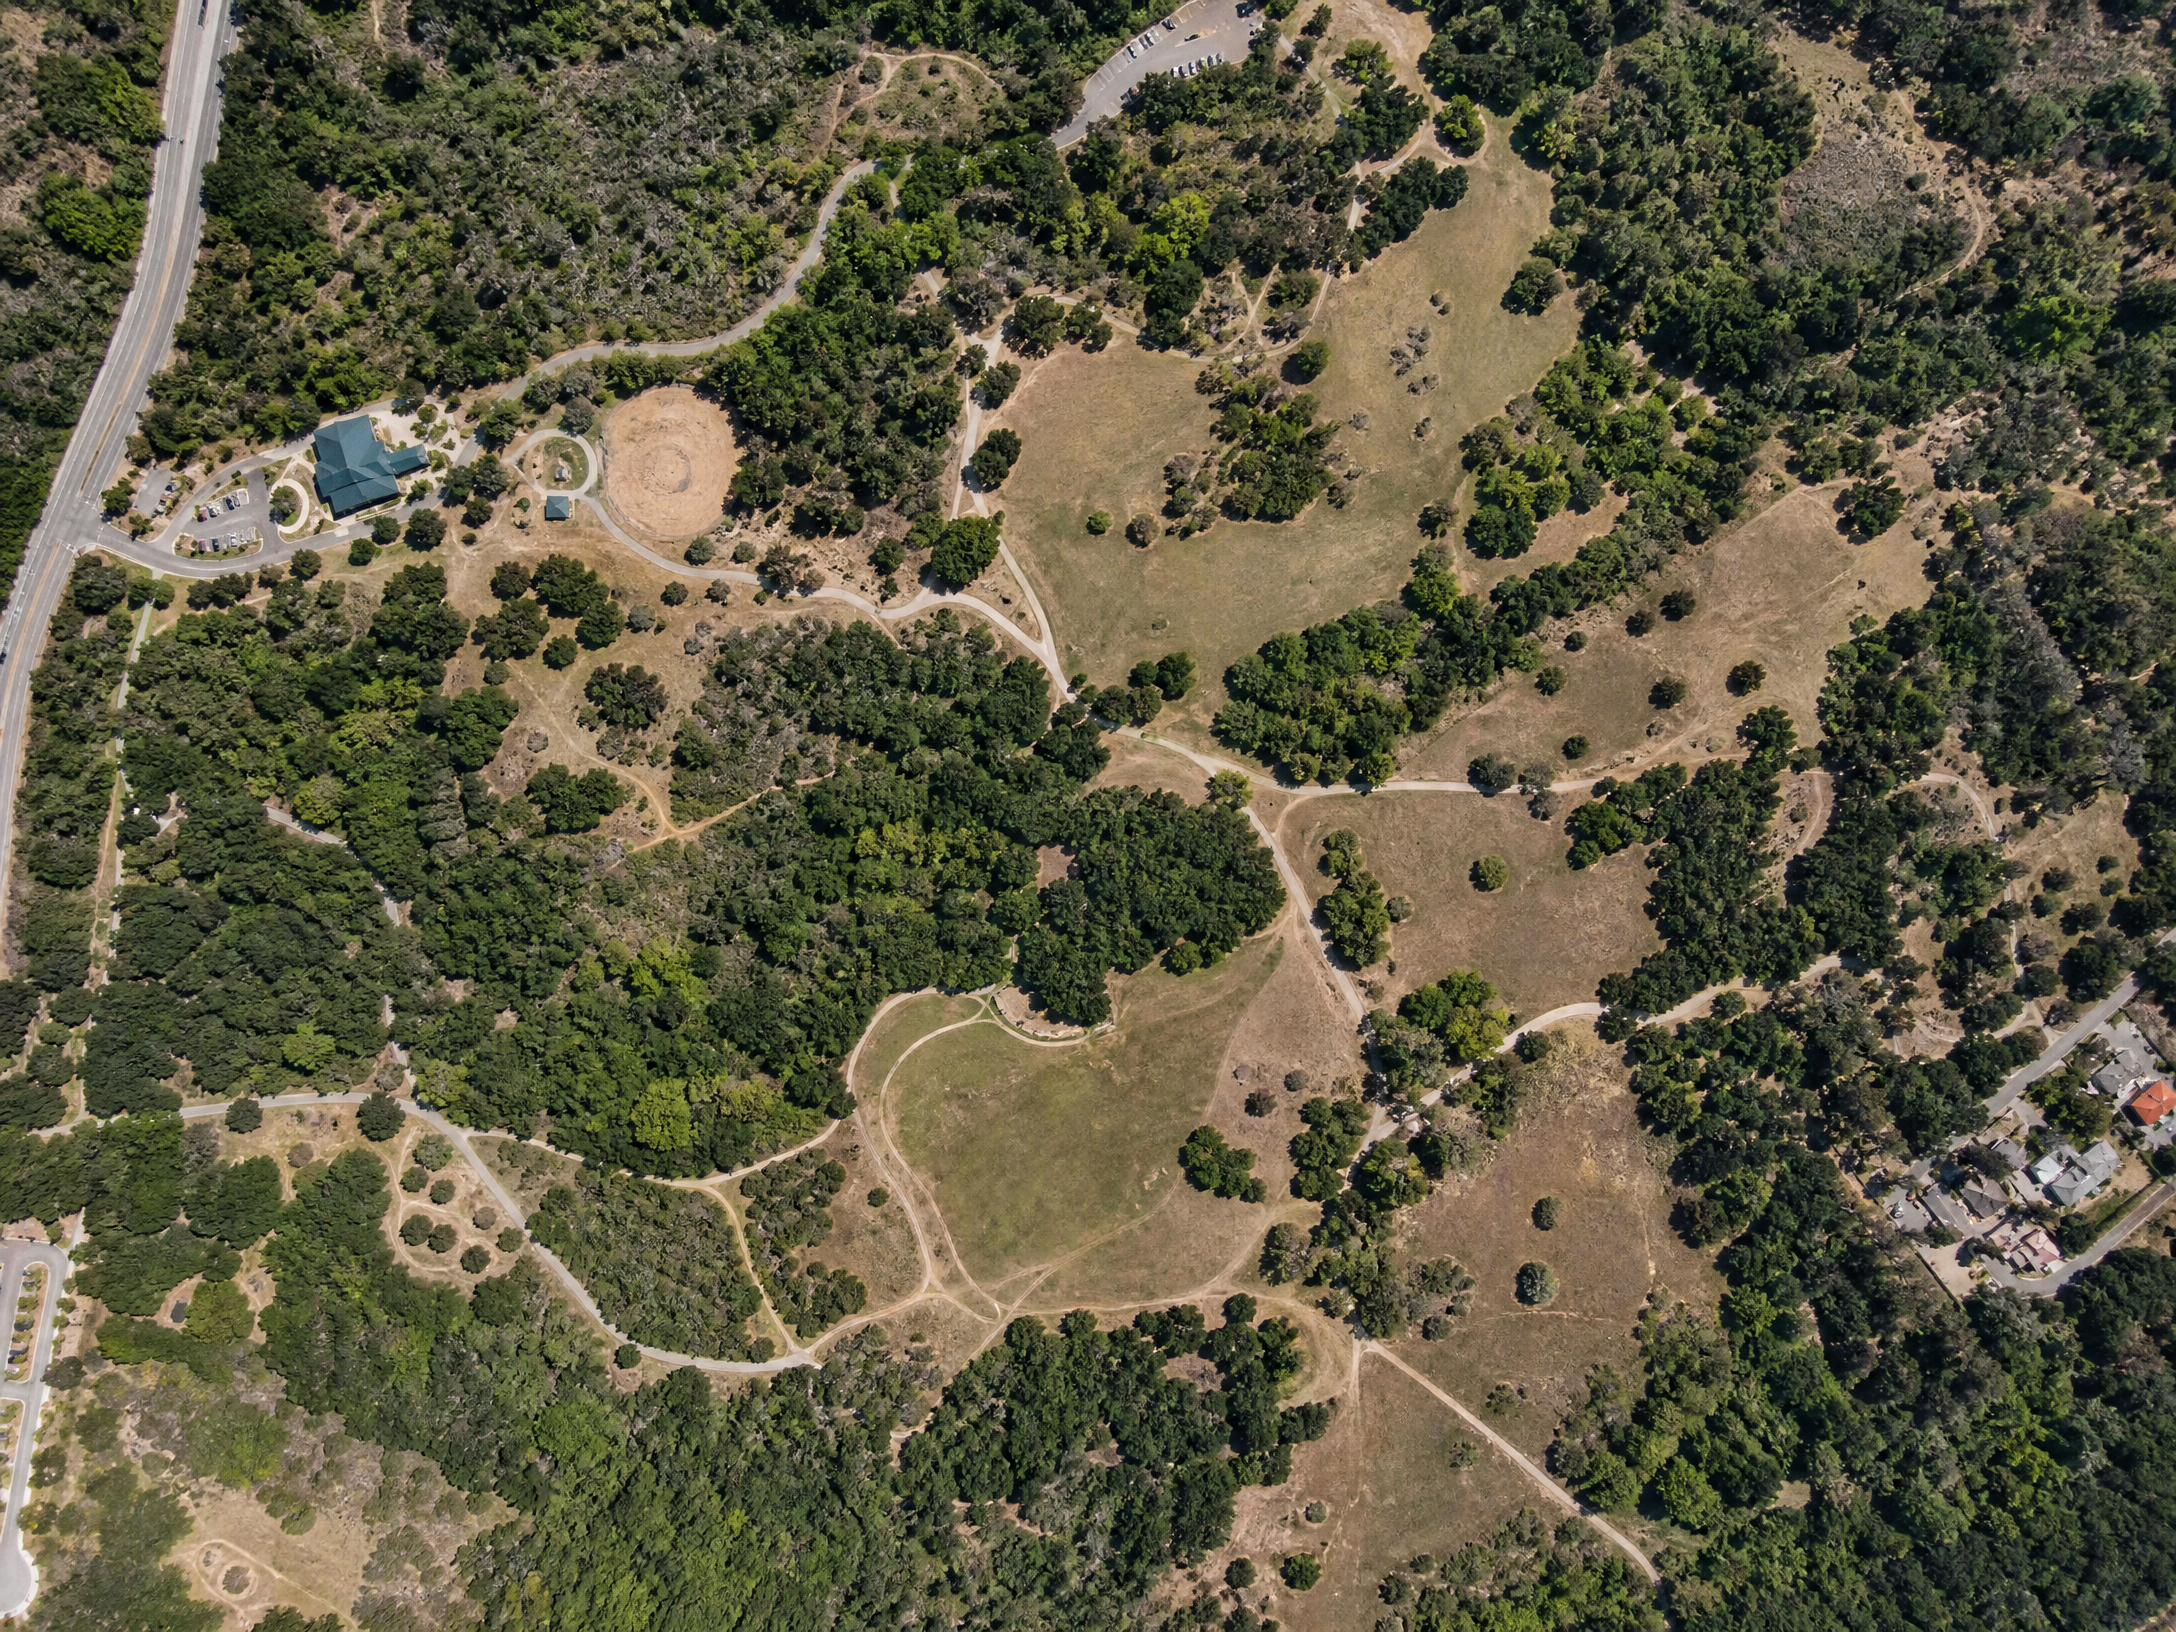
We produce survey-grade 2D orthomosaic maps with centimeter-level ground sample distance (GSD). Our photogrammetry workflow uses structure-from-motion processing to stitch hundreds of overlapping images into a single, geometrically corrected map.
Deliverables are georeferenced and compatible with all major GIS platforms, making them immediately useful for planning, permitting, and asset management workflows.
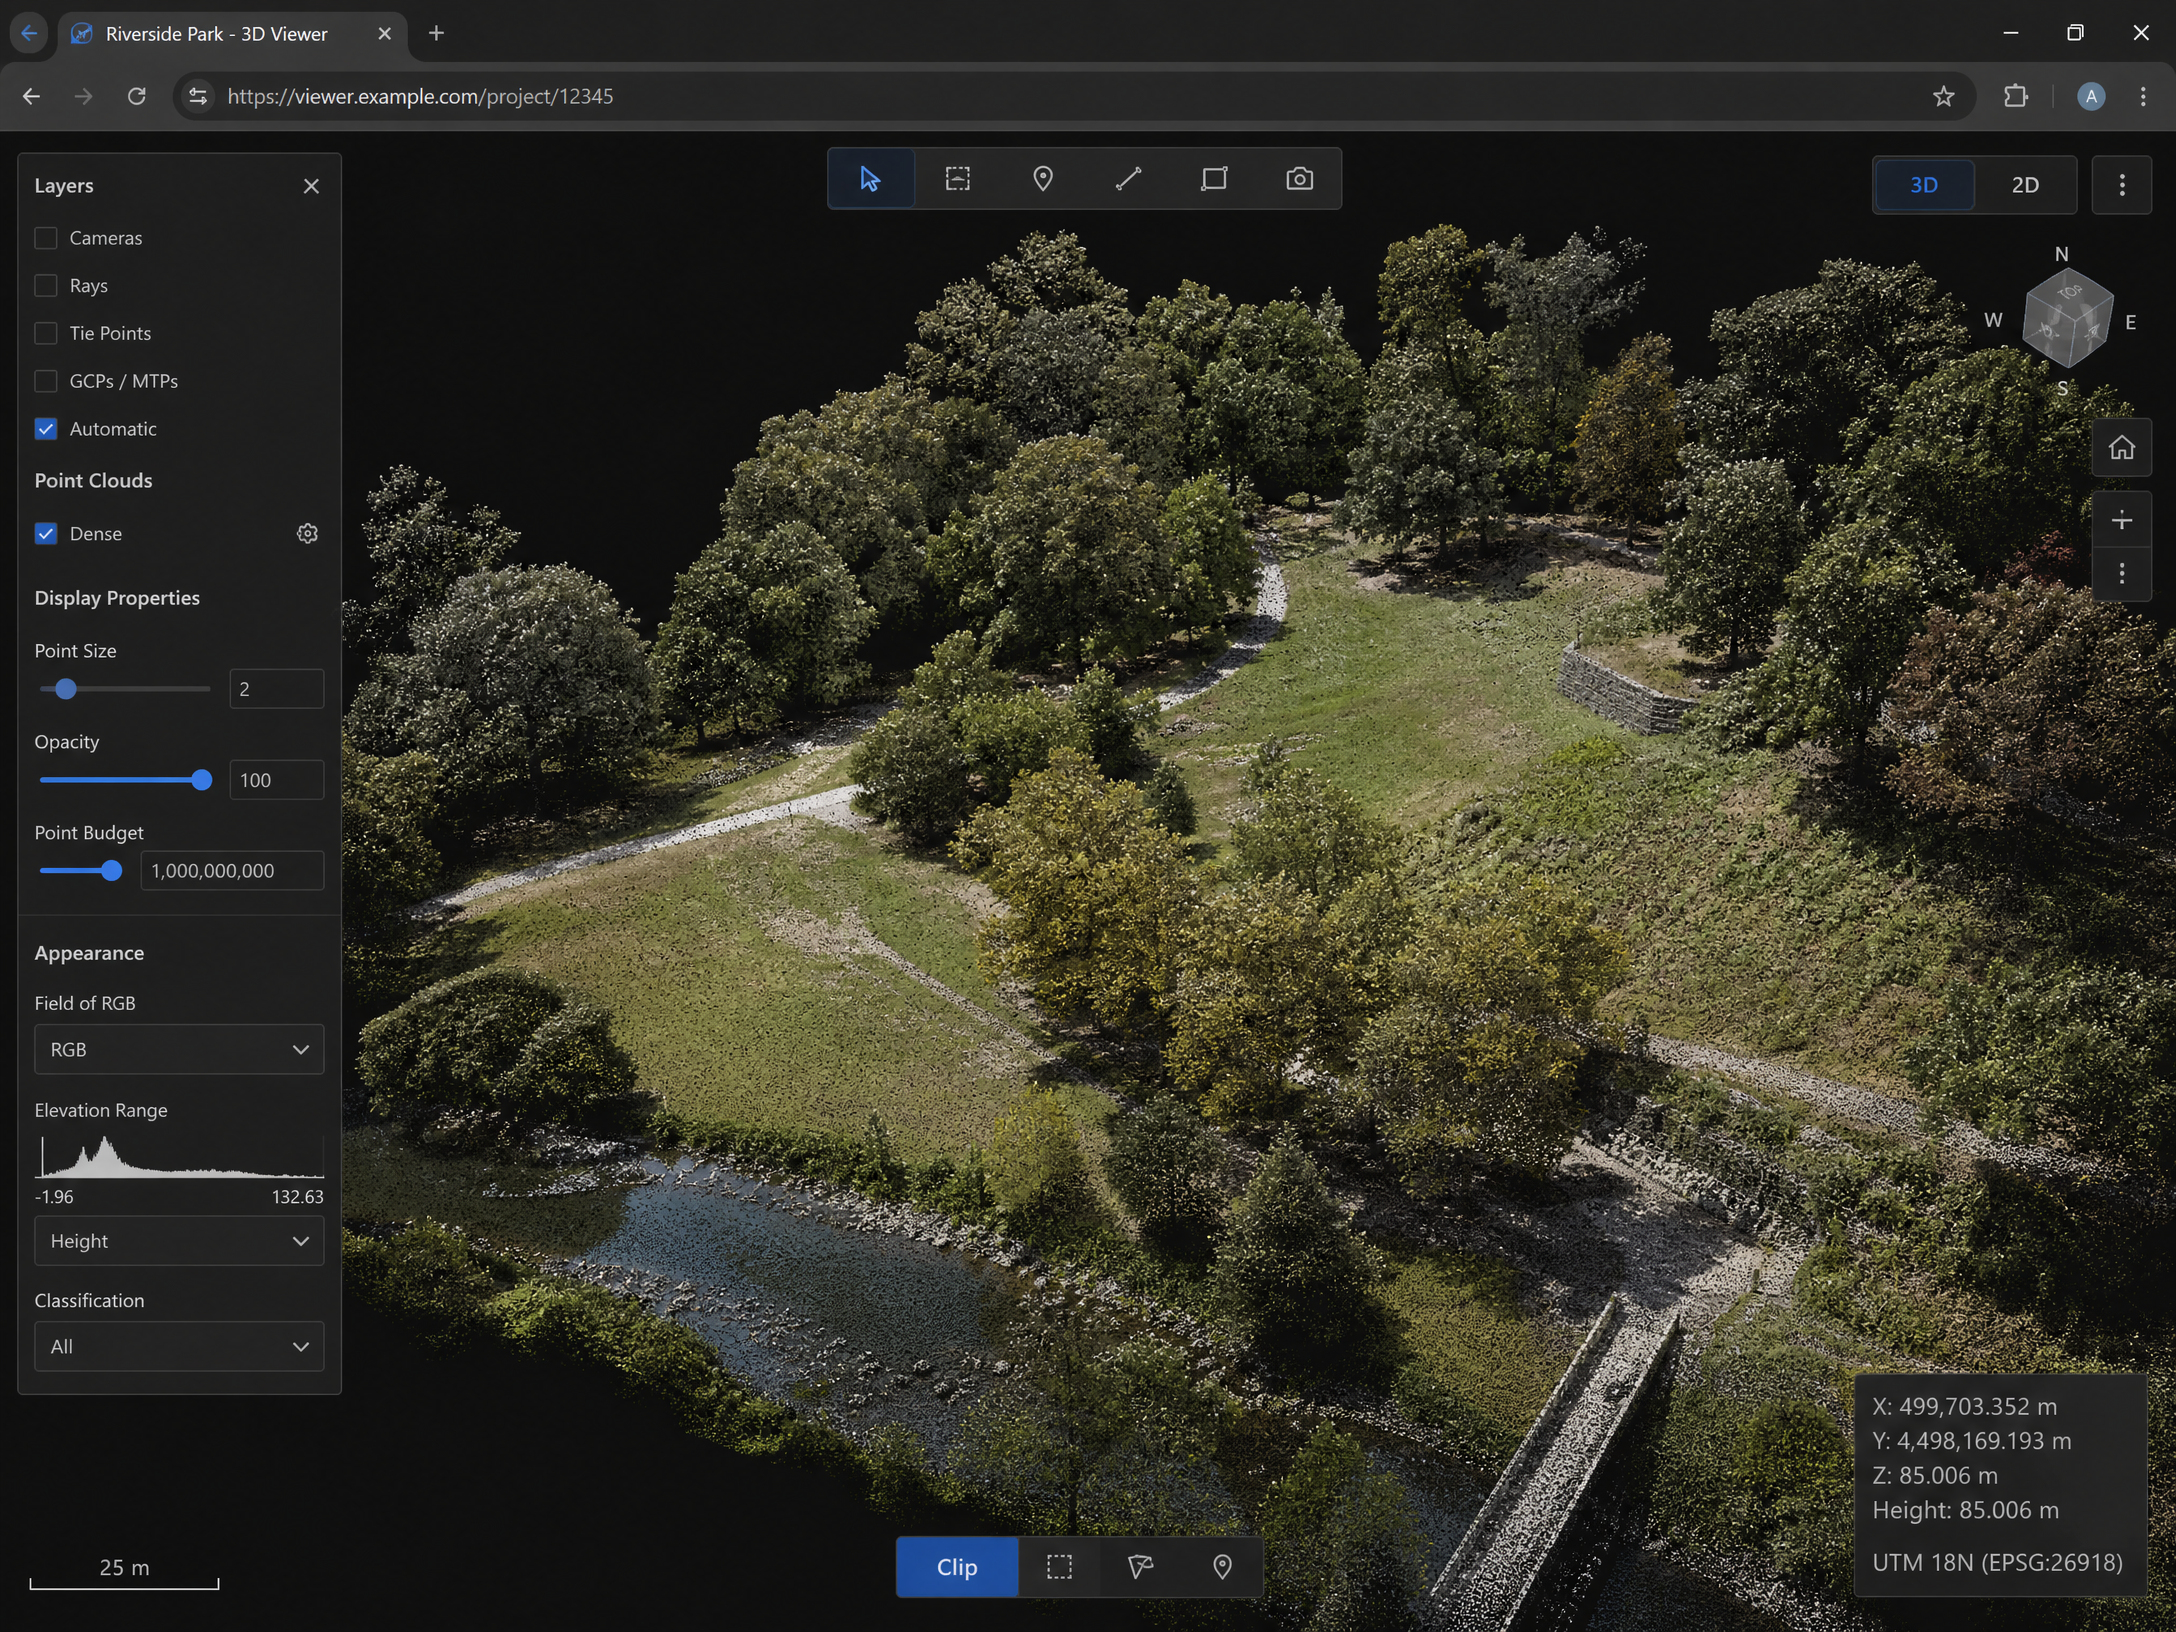
Beyond flat maps, we generate fully textured 3D mesh models and dense point clouds that allow stakeholders to explore a site in three dimensions. These models are ideal for volumetric analysis, canopy height mapping, and compelling project presentations.
Interactive 3D models can be embedded directly into your website or shared via a secure link, making it easy to communicate findings to non-technical audiences.
Ongoing, scheduled aerial surveys that track change over time β the most powerful way to manage living landscapes.
Identify individual trees under stress, detect pest infestations, and track canopy decline across parks, streetscapes, and managed forests.
Map the distribution of invasive plants using their unique spectral signatures. Prioritize removal efforts and track eradication progress over time.
Document restoration project success with before-and-after surveys. Provide defensible data for grant reporting and regulatory compliance.
Identify dry zones, over-watered areas, and system inefficiencies across large irrigated landscapes. Reduce water waste and protect plant health.
Map fuel load and vegetation stress to identify high-risk areas. Support fire prevention planning with accurate, up-to-date aerial data.
Automated comparison between survey dates highlights areas of change, providing a clear picture of landscape evolution over seasons or years.